Parsing Audio
This page demonstrates the parsing process for audio events.
Preparing Sample Event Logs
First, let’s import some libraries and prepare the environment for our sample event logs:
>>> import os
>>> import tempfile
>>> import numpy as np
>>> # Prepare temp dirs for storing event files
>>> tmpdirs = {}
Before parsing a event file, we need to generate it first. The sample event files are generated by three commonly used event log writers.
We can generate the events by PyTorch:
>>> tmpdirs['torch'] = tempfile.TemporaryDirectory()
>>> from torch.utils.tensorboard import SummaryWriter
>>> log_dir = tmpdirs['torch'].name
>>> rate = 22050  # samples per second
>>> T = 3         # sample duration (seconds)
>>> f = 440.0     # sound frequency (Hz)
>>> t = np.linspace(0, T, T*rate, endpoint=False)
>>> x = np.sin(2*np.pi * f * t)
>>> x = np.expand_dims(x, axis=0) # single channel
>>> writer = SummaryWriter(log_dir)
>>> writer.add_audio('my_audio', x, 0, rate)
>>> writer.close()
and quickly check the results:
>>> from tbparse import SummaryReader
>>> SummaryReader(log_dir, pivot=True).audio.columns
Index(['step', 'my_audio'], dtype='object')
We can generate the events by TensorFlow2 / Keras:
>>> tmpdirs['tensorflow'] = tempfile.TemporaryDirectory()
>>> import tensorflow as tf
>>> log_dir = tmpdirs['tensorflow'].name
>>> rate = 22050  # samples per second
>>> T = 3         # sample duration (seconds)
>>> f = 440.0     # sound frequency (Hz)
>>> t = np.linspace(0, T, T*rate, endpoint=False)
>>> x = np.sin(2*np.pi * f * t)
>>> x = np.expand_dims(x, axis=1) # single channel
>>> x = np.expand_dims(x, axis=0) # batch size = 1
>>> x = x.astype(np.float32)
>>> writer = tf.summary.create_file_writer(log_dir)
>>> writer.set_as_default()
>>> assert tf.summary.audio('my_audio', x, rate, step=0)
>>> writer.close()
and quickly check the results:
>>> from tbparse import SummaryReader
>>> SummaryReader(log_dir, pivot=True).tensors.columns
Index(['step', 'my_audio'], dtype='object')
Warning
The tf.summary.audio function has a parameter max_outputs
that limits the maximum number of stored audio instances.
Warning
In the new versions of TensorFlow, the audio method actually
stores the events as tensors events inside the event file. Thus, you should perform
an extra step with tensor_to_audio() beforehand
if the event file is generated by TensorFlow2. (An example is shown later)
We can generate the events by TensorboardX:
>>> tmpdirs['tensorboardX'] = tempfile.TemporaryDirectory()
>>> from tensorboardX import SummaryWriter
>>> log_dir = tmpdirs['tensorboardX'].name
>>> rate = 22050  # samples per second
>>> T = 3         # sample duration (seconds)
>>> f = 440.0     # sound frequency (Hz)
>>> t = np.linspace(0, T, T*rate, endpoint=False)
>>> x = np.sin(2*np.pi * f * t)
>>> x = np.expand_dims(x, axis=1) # single channel
>>> writer = SummaryWriter(log_dir)
>>> writer.add_audio('my_audio', x, 0, rate)
>>> writer.close()
and quickly check the results:
>>> from tbparse import SummaryReader
>>> SummaryReader(log_dir, pivot=True).audio.columns
Index(['step', 'my_audio'], dtype='object')
Parsing Event Logs
In different use cases, we will want to read the event logs in different styles.
We further show different configurations of the tbparse.SummaryReader class.
Load Event File / Run Directory
>>> from tbparse import SummaryReader
>>> log_dir = tmpdirs['torch'].name
>>> # Long Format
>>> df = SummaryReader(log_dir, extra_columns={'sample_rate'}).audio
>>> df.columns
Index(['step', 'tag', 'value', 'sample_rate'], dtype='object')
>>> # Wide Format
>>> df = SummaryReader(log_dir, pivot=True, extra_columns={'sample_rate'}).audio
>>> df.columns
Index(['step', 'my_audio', 'my_audio/sample_rate'], dtype='object')
>>> from tbparse import SummaryReader
>>> log_dir = tmpdirs['tensorflow'].name
>>> # Long Format
>>> df = SummaryReader(log_dir).tensors
>>> df.columns
Index(['step', 'tag', 'value'], dtype='object')
>>> audio_dict_arr = df['value'].apply(SummaryReader.tensor_to_audio)
>>> df['value'] = audio_dict_arr.apply(lambda x: x['audio'])
>>> df['sample_rate'] = audio_dict_arr.apply(lambda x: x['sample_rate'])
>>> df.columns
Index(['step', 'tag', 'value', 'sample_rate'], dtype='object')
>>> # Wide Format
>>> df = SummaryReader(log_dir, pivot=True).tensors
>>> df.columns
Index(['step', 'my_audio'], dtype='object')
>>> audio_dict_arr = df['my_audio'].apply(SummaryReader.tensor_to_audio)
>>> df['my_audio'] = audio_dict_arr.apply(lambda x: x['audio'])
>>> df['my_audio/sample_rate'] = audio_dict_arr.apply(lambda x: x['sample_rate'])
>>> df.columns
Index(['step', 'my_audio', 'my_audio/sample_rate'], dtype='object')
>>> from tbparse import SummaryReader
>>> log_dir = tmpdirs['tensorboardX'].name
>>> # Long Format
>>> df = SummaryReader(log_dir, extra_columns={'sample_rate'}).audio
>>> df.columns
Index(['step', 'tag', 'value', 'sample_rate'], dtype='object')
>>> # Wide Format
>>> df = SummaryReader(log_dir, pivot=True, extra_columns={'sample_rate'}).audio
>>> df.columns
Index(['step', 'my_audio', 'my_audio/sample_rate'], dtype='object')
Warning
When accessing SummaryReader.images, the events stored in
each event file are collected internally. The best practice is to store the
returned results in a DataFrame as shown in the samples, instead of repeatedly
accessing SummaryReader.images.
Extra Columns
See the Extra Columns page for more details.
Plotting Events
We further demonstrate some basic techniques for plotting our data.
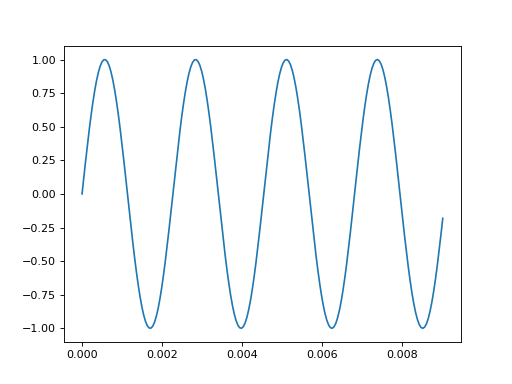
The data from tensorboard event logs:
import matplotlib.pyplot as plt
from tbparse import SummaryReader
log_dir = tmpdirs['torch'].name

df = SummaryReader(log_dir, extra_columns={'sample_rate'}).audio
x = df.loc[0, 'value']
rate = int(df.loc[0, 'sample_rate'])

T = len(x)//rate
t = np.linspace(0, T, T*rate, endpoint=False)
plt.plot(t[:200], x[:200])

The data from tensorboard event logs:
import matplotlib.pyplot as plt
from tbparse import SummaryReader
log_dir = tmpdirs['tensorflow'].name

df = SummaryReader(log_dir).tensors
audio_dict_arr = df['value'].apply(SummaryReader.tensor_to_audio)
df['value'] = audio_dict_arr.apply(lambda x: x['audio'])
df['sample_rate'] = audio_dict_arr.apply(lambda x: x['sample_rate'])
x = df.loc[0, 'value']
rate = int(df.loc[0, 'sample_rate'])

T = len(x)//rate
t = np.linspace(0, T, T*rate, endpoint=False)
plt.plot(t[:200], x[:200])

The data from tensorboard event logs:
import matplotlib.pyplot as plt
from tbparse import SummaryReader
log_dir = tmpdirs['tensorboardX'].name

df = SummaryReader(log_dir, extra_columns={'sample_rate'}).audio
x = df.loc[0, 'value']
rate = int(df.loc[0, 'sample_rate'])

T = len(x)//rate
t = np.linspace(0, T, T*rate, endpoint=False)
plt.plot(t[:200], x[:200])
The ground truth data:
import matplotlib.pyplot as plt

rate = 22050  # samples per second
T = 3         # sample duration (seconds)
f = 440.0     # sound frequency (Hz)
t = np.linspace(0, T, T*rate, endpoint=False)
x = np.sin(2*np.pi * f * t)
x = np.expand_dims(x, axis=1) # single channel

plt.plot(t[:200], x[:200])